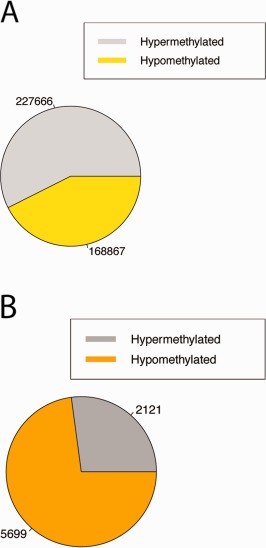
Figure 2.

Global DNA methylation differences between labial salivary glands from the Sjögren's syndrome cases and the controls. A, Proportions of hyper‐ and hypomethylated CpGs with q values >0.01 by Wilcoxon's rank sum test. These represent a control set of CpGs, or non–differentially methylated positions (DMPs). Direction of methylation is determined by the sign of the difference in the mean β values between cases and controls. B, Proportions of hyper‐ and hypomethylated DMPs with q values <0.01 by Wilcoxon's rank sum test. DMPs are significantly enriched for hypomethylated sites as compared to non‐DMPs (P < 2.2 × 10⁻¹⁶ by Fisher's exact test).
