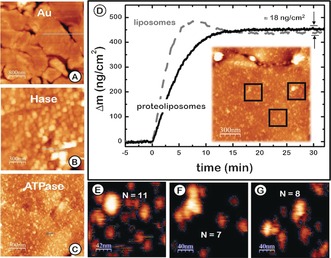
Figure 2.

A–C) AFM topography images of A) the bare annealed gold surface, B) the Hase monolayer and C) the F1Fo ATPase reconstituted into the PhBL spread on the Hase monolayer. D) QCM monitoring of liposome (dashed line) and F1F0 proteoliposome (solid line) adsorption to a SiO2 surface. Inset: AFM image of an F1F0‐ATPase‐containing PhBL. E–G) Three regions from AFM image in (D) used to estimate the average number of proteins protruding more than 5 nm (N=9 per 200×200 nm2 ).
