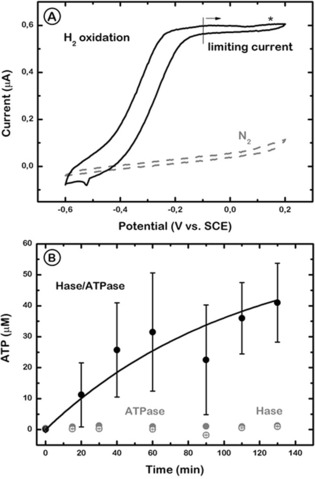
Figure 3.

A) Cyclic voltammograms of the Hase/PhBL/ATPase‐modified electrode in 0.1 m phosphate buffer (pH 8.0) after Hase activation through H2 incubation (solid line) or under N2 before activation (dashed line). The star indicates the redox potential (150 mV vs. SCE) applied to drive ATP production. Scan rate=0.01 V s−1. Temperature=30 °C. B) ATP synthesis from ADP and phosphate in 0.1 m phosphate buffer (pH 8.0) at 150 mV and under 1 atm H2. ATP concentration in the bulk solution is shown as a function of time for Hase/PhBL/ATPase (black solid circles), PhBL/ATPase (gray solid circles), and Hase/PhBL (gray open circles) electrodes. Error bars=standard deviation of three measurements made from different electrode preparations.
