
Figure 1.
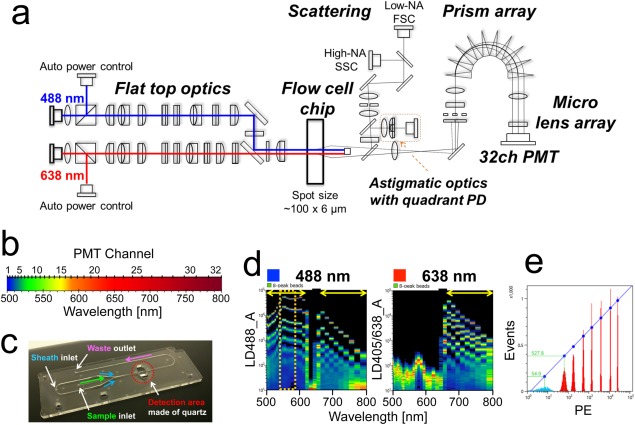
Design and characterization of the spectral‐FCM. a) Unique optical designs adopted by the spectral FCM, 488/638 nm non‐coaxial dual lasers, flow cell chip, amorphous‐Si PD, quadrant PD, prisms, micro lens array, and 32ch PMT. b) Wavelength ranges of individual each channel in 32ch PMT. More channels are applied in the blue‐green region than red one in order to increase the wavelength resolution in that region. This optical configuration was achieved by using unique prism optics. c) Image of a flow cell chip. Blue, green, and pink arrows mark sheath, sample, and waste flows, respectively. Red dash circle marks detection area made of quartz. d) Spectrum charts acquired by the detection of Ultra Rainbow 8‐peaks beads. Acquired spectra by 488 nm laser excitation (left) and 638 nm (right) are shown, respectively. Wavelengths from 500 nm to 800 nm as the abscissa and fluorescent intensities as the ordinate are indicated. The colors in charts indicate densities of each channel. Red shows high density, green shows middle, and blue shows low, respectively. The 20th−23rd channels in the 32ch PMT are shielded by a mask to prevent 638 nm laser shining into the PMT and not detected in the dual laser mode (488 nm and 638 nm excitations). Yellow arrows in plots show regions where fluorescence data are used when the spectral‐FCM is run in dual laser mode. e) Histogram of acquired data by the detection of Ultra Rainbow 8‐peaks beads in PE region (Fig. 1d; left, orange dash line). MESF and linearity was calculated depending on this data. 54.0 and 527.8 shows mean fluorescent intensities from the lowest intensity beads (light blue) and the second lowest intensity beads (red, right next to light blue), respectively.