
Figure 5.
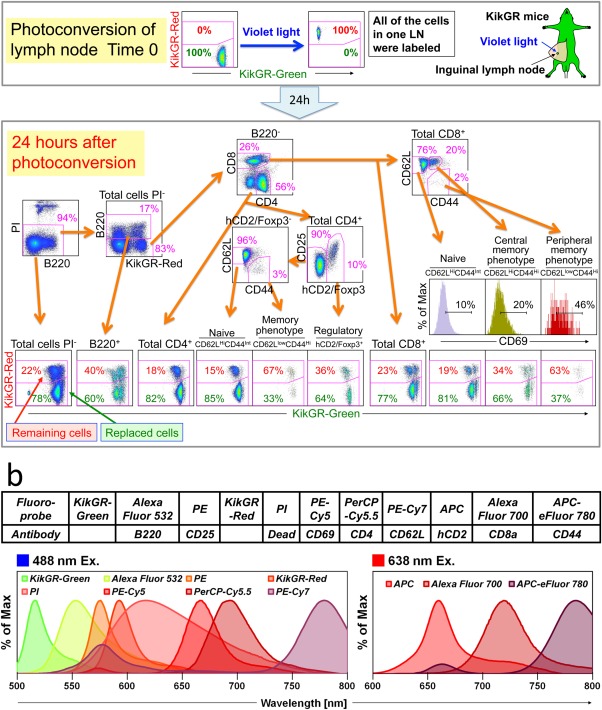
11‐Color analysis using KikGR mice. a) 11‐color analysis including two FPs and nine fluorochromes. The inguinal lymph node was exposed to violet light. Twenty‐four hours after photoconversion, cells from photoconverted inguinal lymph node were stained with fluorochrome‐conjugated antibodies and PI as described in b. Acquired data sets were unmixed with WLSM and are shown in dot‐plots. PI‐positive dead cells were gated out and B cells were gated as B220+ cells. B220‐ cells were gated into CD4+ and CD8+ cells. CD4+ cells were subdivided into hCD2/Foxp3+ regulatory T cells and hCD2/Foxp3‐ non‐regulatory T cells. hCD2/Foxp3‐ non‐regulatory T cells were further gated into naive (CD62LHighCD44Low) and memory phenotype (CD62LLowCD44High) cells. On the other hand, CD8+ T cells were subdivided into naive, central memory (CD62LHighCD44High), and peripheral memory (CD62LLowCD44High) phenotype cells. CD69 expressions in each CD8+ T‐cell subset are shown in histograms. Data are representative of two individual experiments. Intensities of stained fluorochromes (biexponential) for gating cell‐populations or fluorescent intensities of KikGR‐Green (biexponential) and KikGR‐Red (biexponential) in each population are shown in dot‐plots. Fluorescent intensities of CD69 (biexponential) as the abscissa are indicated in histograms. b) FPs and stained fluorochrome‐conjugated antibodies and PI and their spectrum. Normalized intensity spectrums of indicated FPs and fluorochromes are shown as the ordinate.