
Figure 5.
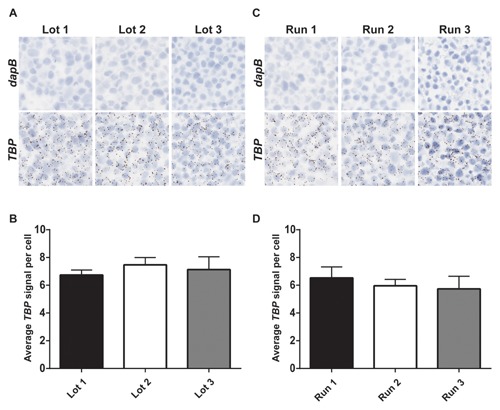
The automated RNAscope ISH assay performs consistently and reproducibly. (A) Three different lots of automated RNAscope assay reagents were generated for the Leica BOND RX automated platform and tested on FFPE sections of HeLa cells with either dapB or Hs‐TBP probe. (B) The average TBP signal per cell, indicating the average number of dots per cell, was quantified for every lot tested on the Leica BOND RX automated platform. Data are presented as mean + SEM; n = 3–8 replicates. (C) Three independent runs of the automated RNAscope assay were performed on FFPE sections of HeLa cells using either dapB or Hs‐TBP probes on the Leica BOND RX automated platform. (D) The average TBP signal per cell, indicating the average number of dots per cell, was quantified for every run performed on the Leica BOND RX automated platform. Data are presented as mean + SEM; n = 3–5 replicates. (A, C) Images are shown at 40× magnification.