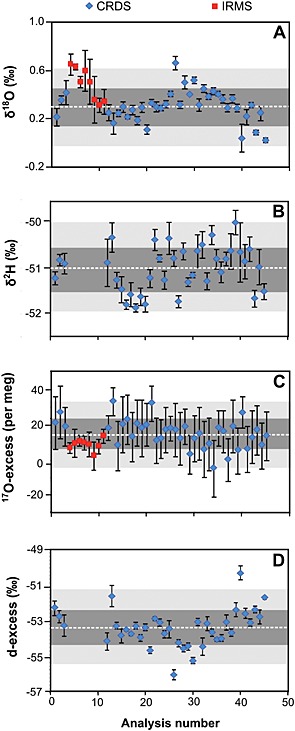
Figure 3.

The δ18O (A), δ2H (B), 17O‐excess (C) and d‐excess (D) values of GHW from the repeated analysis of a gypsum standard (NEWGYP), extracted using the WASP and analyzed by CRDS (n = 37) and IRMS (n = 8). δ17O displayed a similar trend to δ18O. Data are displayed following the order in which the samples were extracted using the WASP. Errors bars refer to the internal error (±1‐sigma obtained from the repeated analysis of the same hydration water (7 injections for CRDS and 3–4 for IRMS). The long‐term means (dashed line) and external errors are shown for ±1‐sigma (deep‐grey shade) and ±2‐sigma (light‐grey shade).
