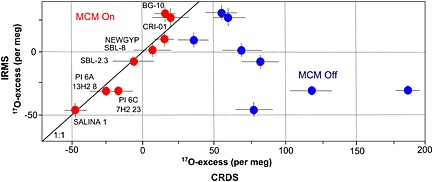
Figure 5.

Cross‐plot of 17O‐excess in synthetic and natural gypsum analyzed by CRDS and IRMS. The analyses by CRDS that used the MCM yielded results similar to those obtained by IRMS. Error bars refer to the consecutive analyses (7 injections for CRDS and 3–4 analyses for IRMS) of the same hydration water.
