
Figure 3.
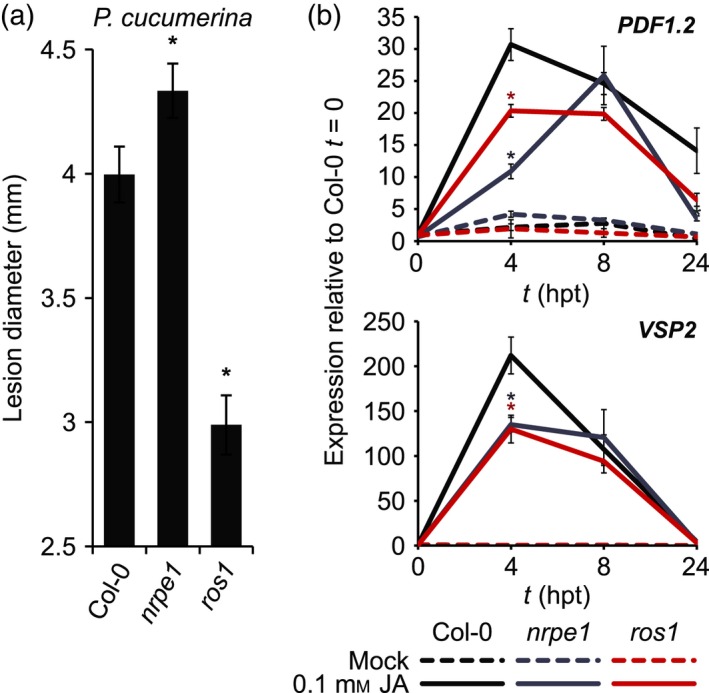
Basal resistance to Plectosphaerella cucumerina and JA‐induced gene expression in nrpe1, ros1 and Col‐0.
(a) Levels of basal resistance to P. cucumerina. Shown are mean lesion diameters (±SEM; 27 plants) at 6 days after droplet inoculation of 4.5‐week‐old plants. Asterisks indicate statistically significant differences between Col‐0 and mutant plants (Student's t‐test; P < 0.05).
(b) RT‐qPCR quantification of PDF1.2 and VSP2 gene expression in Col‐0, nrpe1 and ros1 at 0, 4, 8 and 24 h after spraying with 0.1 mm jasmonic acid (JA). Data represent mean values of relative expression (±SEM; n = 3). Asterisks indicate statistically significant differences in comparison to Col‐0 samples (Student's t‐test; P < 0.05).