
Figure 2.
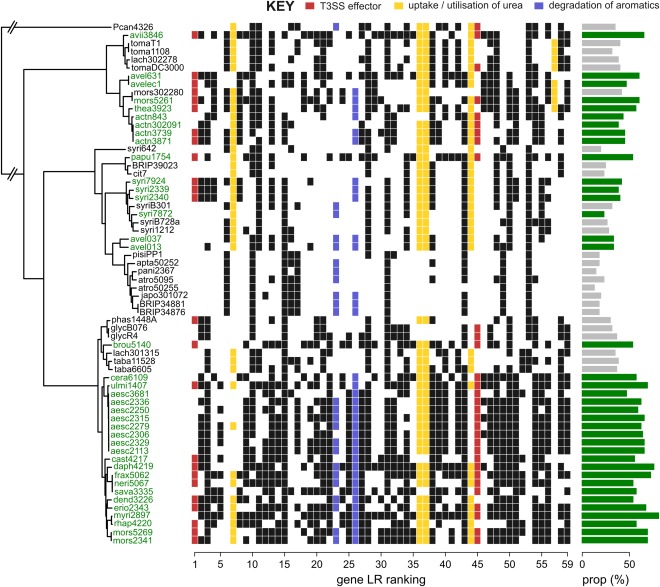
Occurrence profile for 59 genes significantly associated with the woody niche. Genes of particular interest are highlighted in colour (see key). Genes are ordered from 1 to 59 corresponding to the magnitude of the likelihood ratio (LR) statistic (decreasing significance); the order of genes is not indicative of physical proximity on the chromosome. Strains are ordered according to the core genome phylogeny; the bar chart on the right shows the proportion of genes (out of 59) present in woody (green) versus non‐woody (grey) host pathogens. T3SS, type III secretion system.