
Figure 4.
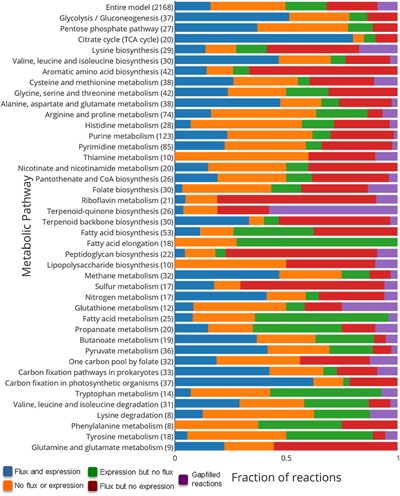
Comparison of flux and expression for post‐gapfilled consortium model. Here, we show the extent of agreement between the reaction activity predicted by FBA and gene expression derived from RNA‐seq data for the consortium postMrTe1312 model. Blue bars denote reactions with both flux and expression, while orange bars denote reactions without flux or expression. Green bars denote reactions with expression but no flux, while red bars denote flux but no expression. Finally, purple bars denote gapfilled reactions active in each pathway. The number of reactions in each metabolic pathway is shown in the parenthesis.