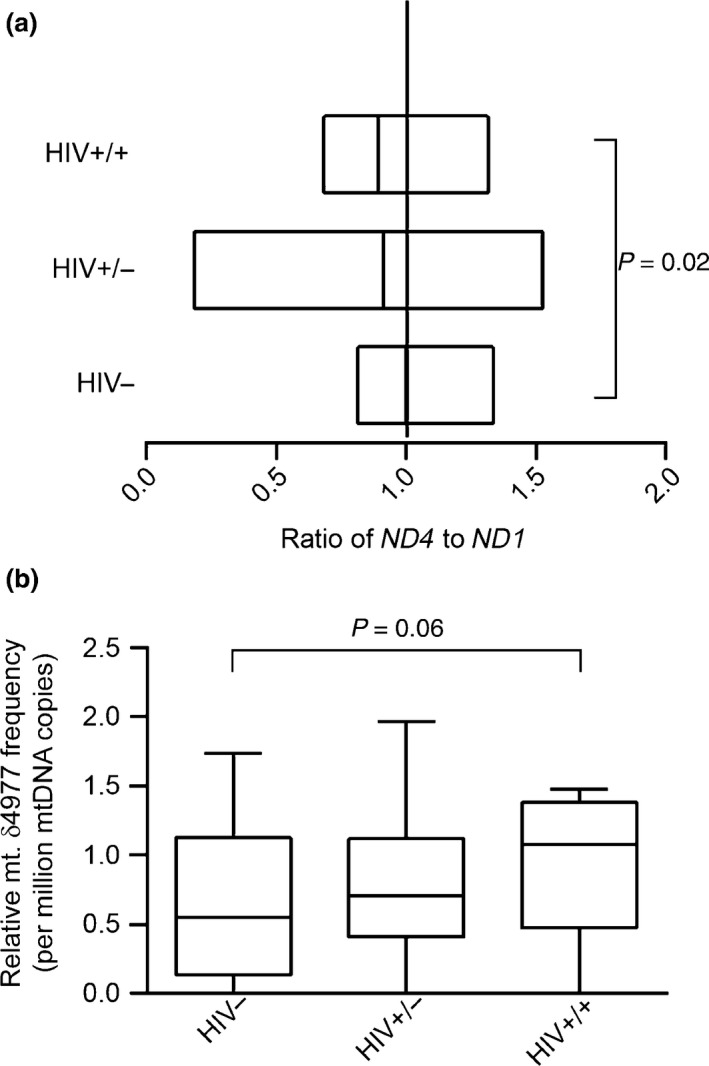
Figure 2.

Mitochondrial DNA large‐scale deletions among study participants. Mitochondrial DNA large‐scale deletions among study participants were determined by comparing the cycle thresholds of amplification of same‐size amplicons in the MT‐ND4 and MT‐ND1 regions. (a) mtDNA large‐scale deletions. The relative amount of ND4 to ND1 was calculated using the following equation: R = 2−∆Ct, where ∆Ct is CtMT‐ND 4 − CtMT‐ND 1. Data are presented as box plots, in which boxes represent the median and the second and third quartile ratios. The vertical line represents an MT‐ND 4 to MT‐ND1 ratio of 1; this is when there are no deletions detected in the MT‐ND4 region. With deletions, the ratio is < 1. (b) The mitochondrial DNA common deletion (CD; mt.δ4977). The frequency of CDs per million molecules of mtDNA was calculated using the following formula: R = 1 × 106 × 2−∆Ct, where ∆Ct is CtCD – CtND 1. Data are represented as box‐and‐stem plots, in which boxes represent the median values and the second and third quartiles, and stems extend to the 10th and 90th percentiles. The cut‐off for significance was set at P < 0.05. HIV−, HIV‐uninfected controls; HIV+/−, HIV‐infected treatment‐experienced patients without toxicity; HIV+/+, HIV‐infected treatment‐experienced patients with toxicity.
