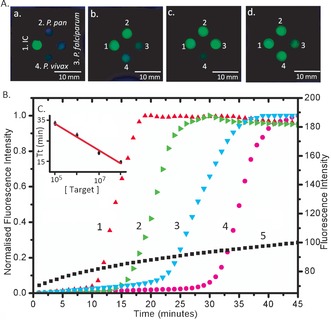
Figure 3.

Results of multiplex LAMP amplification under UV light. Under UV excitation, green calcein emission occurs in the presence of pyrophosphate A) Numbers denote different species‐specific LAMP reaction. 1. Internal control (IC); 2. Plasmodium pan; 3. P. falciparum; 4. P. vivax. Letters denote the different positive results: a. 1 positive; b. 1 and 2 positive; c. 1, 2 and 3 positive; d. all positive. B) Real‐time amplification curve of Plasmodium pan LAMP with the 10‐fold serially diluted target (1–4, normalized real‐time amplification curves), and ddH2O as a negative control (5): 1. 108 IU/mL (red up‐triangle); 2. 107 IU/mL (green right‐triangle); 3. 106 IU/mL (cyan down‐triangle); 4. 105 IU/mL (magenta circle). 5. Negative control (black square: no target DNA). As the concentration increases, the amplification is initiated earlier, evidenced by the exponential increase in the fluorescence. C) Threshold time (defined as the time corresponding to 50 % of the maximum fluorescence intensity, Tt) as a function of target concentration. This Figure of merit is analogous to the cycle threshold (Ct) of real‐time PCR.23 Data is the average of three repeats and error bars represent the standard deviation. The data was fitted with linear regression (R 2=0.98).
