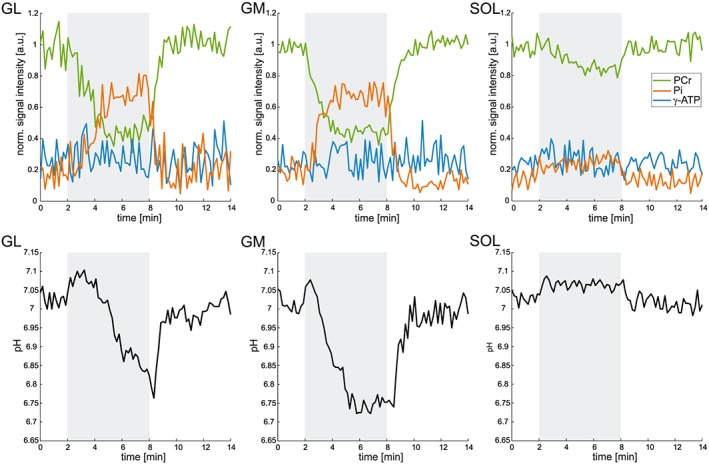
Figure 4.

Time courses of the PCr (green), Pi (orange) and ATP (blue) signal intensities, normalized to the resting PCr signal intensity (top panel), and of pH (bottom panel), measured in all investigated muscles (2–4 voxels). The higher PCr depletion and pH drop in GL and GM indicate the prevailing involvement of these muscles in the plantar flexion exercise (0° flexion of the knee). The exercise period (6 min) is shaded grey
