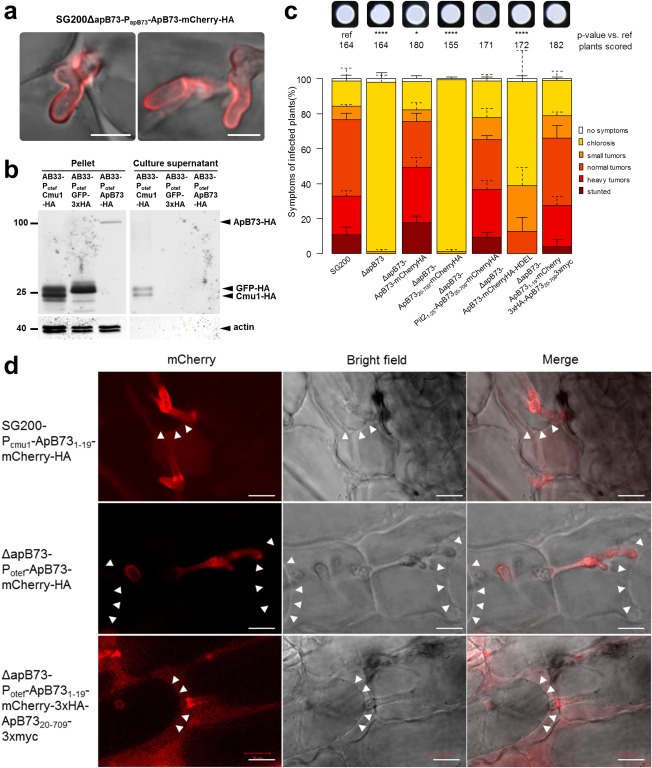
Figure 3.

Localization of the ApB73 protein and the role of its signal peptide. (a) Secretion of ApB73‐mCherry‐HA protein in infected maize plants. Leaves of maize cv. B73 were infected with SG200ΔapB73‐ApB731–709‐mCherry‐HA and fluorescence was observed at 5 days post‐infection (dpi). Bar, 5 μm. (b) Detection of ApB73‐HA protein in culture supernatants. ApB73‐HA was expressed by strain AB33‐Potef‐ApB73‐HA after shifting the cells to nitrate‐containing medium for 6 h to induce filamentation. AB33‐Potef‐Cmu1‐HA was used as a positive control and AB33‐Potef‐GFP‐3×HA as a negative control. Supernatants were collected; the proteins present were precipitated with trichloroacetic acid (TCA)/Sodium deoxycholate (DOC) and subjected to Western blot analysis using anti‐haemagglutinin (HA) and anti‐actin antibodies. Compared to Cmu1‐HA, five times more precipitated supernatant‐derived proteins of ApB73‐HA were loaded. Numbers on the left indicate the size in kilodaltons (kDa). (c) Virulence assay confirming the essential role of the ApB73 signal peptide and the complementation of the C‐ and N‐terminal fusions to mCherry. Strains expressing ApB73 without SP (ApB7320–709), with a different SP (Pit21–25‐ApB7320–709), the endoplasmic reticulum (ER) retention signal HDEL (ApB731–709mCherryHA‐HDEL) or in C‐ or N‐terminal fusion to mCherry were compared to the deletion strain (ΔapB73) and the progenitor strain SG200 in a seedling infection assay using maize cv. B73. All strains were expressed under the native apB73 promoter, except for the N‐terminal mCherry fusion (otef promoter). In the top row, photographs of the respective strain are shown after growth on filamentation‐inducing charcoal plates for 24 h. Disease scores obtained at 12 dpi are shown on the right. The mean values of three independent infections are depicted and the total number of infected plants is indicated above the respective columns. The mean and standard deviation of relative counts from replicates are displayed. For clarity, only positive error bars are shown. P values were calculated by Fisher's exact test. Multiple testing correction was performed using the Benjamini–Hochberg procedure.*P < 0.05; ****P < 0.0001. (d) Effect of plasmolysis on the localization of different ApB73 fusion proteins. Maize plants of cv. B73 were infected with strains expressing ApB731–19mCherry‐HA, ApB73‐mCherry‐HA or ApB731–19‐mCherry‐3×HA‐ApB7320–709−3×myc, harvested at 3 dpi and observed after treatment with 1 m mannitol. Arrowheads indicate the plant plasma membrane pulling away from the cell wall. Bar, 10 µm.
