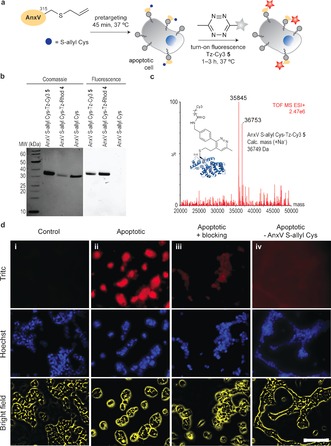
Figure 3.

a) Pre‐targeting of apoptotic cells with AnxV S‐allyl Cys followed by IEDDA labeling with fluorogenic Tz‐Cy3 5. b) SDS‐PAGE of AnxV labeled with Tz‐Rhod 4 and Tz‐Cy3 5 for 12 h at 37 °C. The labeled protein was purified by dialysis. Left image shows Coomassie blue‐stained gels and the right image presents the fluorescent imaging of the same gels before staining with Coomassie blue. c) ESI‐MS spectrum of the product of the reaction of AnxV S‐allyl Cys with Tz‐Cy3 5. d) Specific labeling of apoptotic cells (ii) pre‐targeted with AnxV S‐allyl Cys and subsequently labeled with Tz‐Cy3 5. Cells were imaged 3 h after addition of the fluorogenic dye 5. Non‐apoptotic cells (i) were included as a control. The specificity of the labeling was confirmed through blocking of cells with non‐labeled AnxV (iii) prior to incubation with AnxV S‐allyl Cys or by treating cells only with the tetrazine probe Tz‐Cy3 5 (iv) without preincubation with the targeting protein AnxV S‐allyl Cys. Apoptotic cells are shown red, while the nuclei counterstained with Hoechst 33 342 are shown blue. Scale bar=100 μm.
