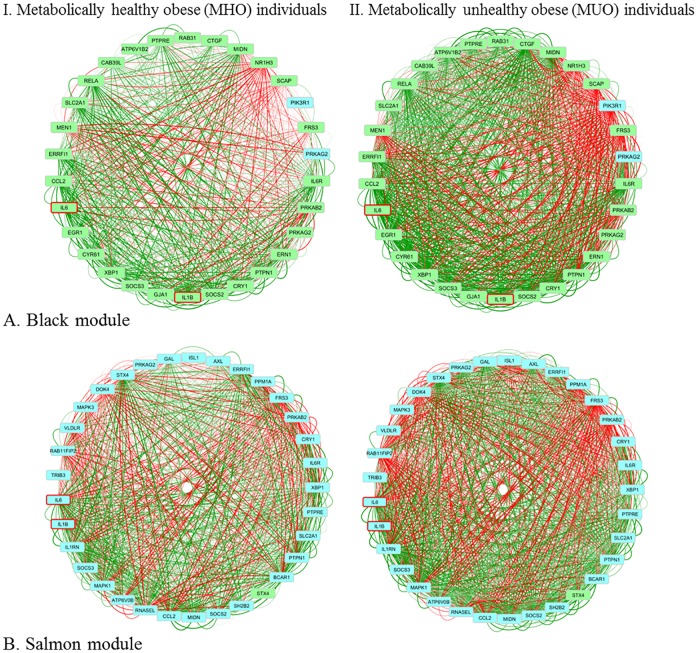
Fig 3. Network visualization of the inter-tissue network modules.
Visualization of the genes in the (A) Black module (from MUO subnetwork) in the MHO and MUO individuals, and (B) Salmon module (from MUO subnetwork) in the MHO and MUO individuals. Genes coming from liver are coloured yellow, from muscle orange, from VAT blue and from SAT green. IL1B and IL-6 are bordered red. Edges are coloured based on their correlation on a red-green scale representing a negative-positive correlation.

