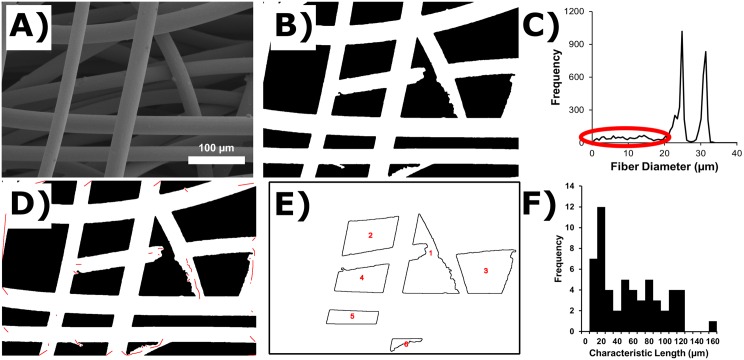
Fig 2. Examples of DiameterJ output.
(A) One of the scanning electron micrographs (SEM) that was used in participant performance assessment is shown. Two gauges of steel wire were entangled to make the sample for the image: 48 gauge (31.1 μm dia.) and 50 gauge (25.6 μm dia.). (B) Segmentation of the SEM image in A. (C) Histogram of all diameters that were calculated from the image by DiameterJ. Red oval indicates “noise”. (D) Red lines indicate location of fiber centerlines that had a dia. between 0 and 20 micrometers and that should be considered “noise”. (E) Outlines of pores (pores touching the edges of the image have been removed). (F) Histogram of characteristic lengths between fiber intersections (bin size 10 μm).

