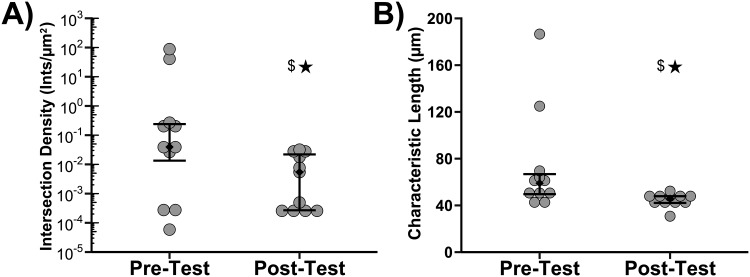
Fig 5. Plot of participant reported intersection density (A) and reported characteristic length between intersections (B) before and after training.
Gray symbols are individual responses and diamonds are median with first and third quartiles (n = 11). Stars indicate that variances were statistically different between the Pre-Test and Post-Test (Flinger-Killeen's Test, P < 0.05). Dollar sign indicates means were statistically different between the Pre-Test and Post-Test (Wilcoxon Signed Rank Test, P<0.05).

