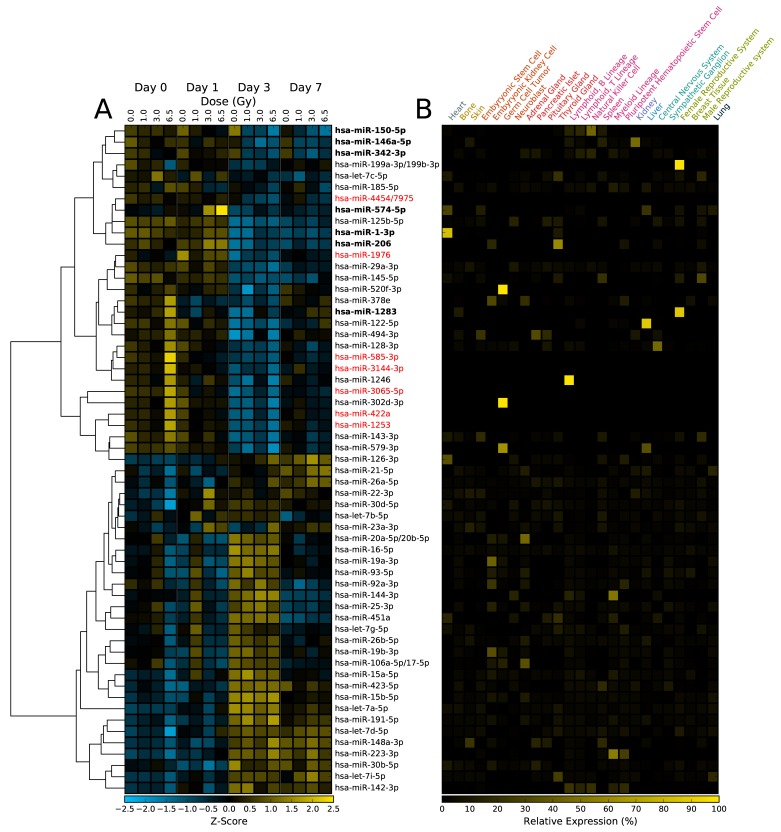
Fig 3. Heatmap of dose- and time-dependent changes in miRNA abundance in NHPs after exposure to ionizing radiation.
(A) Of the approximately 800 miRNA sequences in the nanoString assay, less than 60 miRNAs were expressed above the limit of detection. Sequences that changed significantly (p-value < 0.05) are labeled in bold. (B) Expression profile of the miRNA for the indicated tissue types [31]. Expression data was not available for sequences labeled in red.

