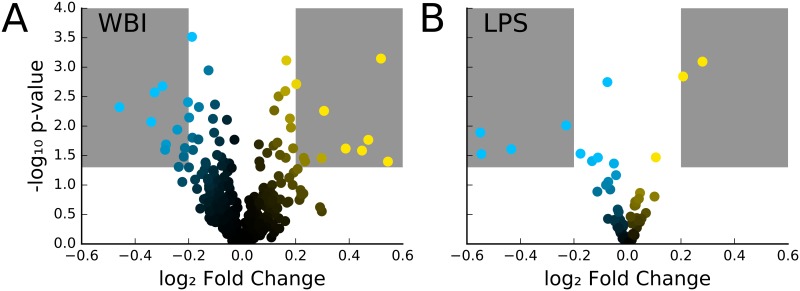
Fig 5.
(A) Volcano plot for each day (1, 3, 7) comparing each radiation dose (1, 3, 6.5 Gy) to control (0 Gy). Regions in the plot shaded in gray indicate an average absolute log2 fold change > 0.2 and p-value < 0.05. As expected, because whole body irradiation doses in the study are at or below LD50, the overall miRNA expression profile in the body remains unchanged. From this plot, we pick the miRNAs that are significantly up or down regulated (shaded region) as candidate biomarkers for further analysis. (B). Volcano plot for comparing miRNA abundance two days after LPS insult for each dose (0.0, 0.7, 2.1, and 2.8 mg/kg, N = 2 for each condition) to pre-treatment (day 0). Regions in the plot shaded in gray indicate a |log2 fold change| > 0.2 and p-value < 0.05.

