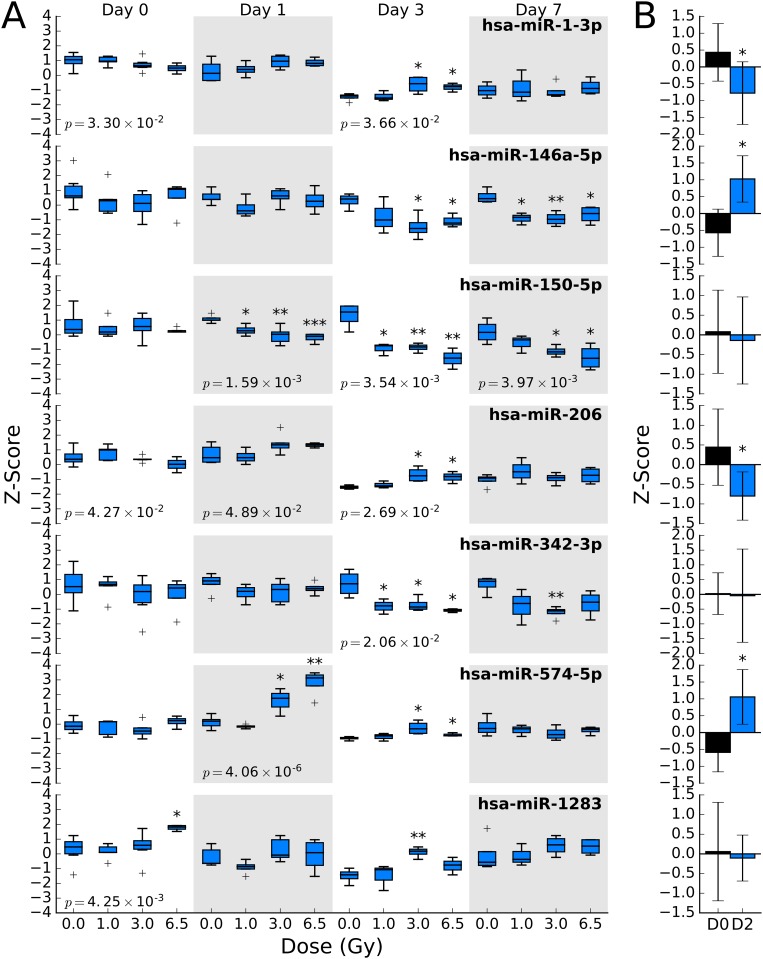
Fig 6.
(A) Dose and time dependence of 7 miRNA sequences that significantly change (p-value < 0.05) after exposure to ionizing radiation at any dose or time point. One-way ANOVA was performed for each sequence at each day. The p-value for the analysis is shown on the box plot in cases where it is less than 0.05. Based on this analysis, hsa-miR-574-5p and hsa-miR-150-5p show significant dose response to WBI. (B) Corresponding changes in miRNA abundance after LPS treatment were significant for hsa-miR-1-3p, hsa-miR-146a-5p, hsa-miR-206, and hsa-miR-574-5p. * = p-value < 0.05, ** = p-value < 0.005, and *** = p-value < 0.0005.

