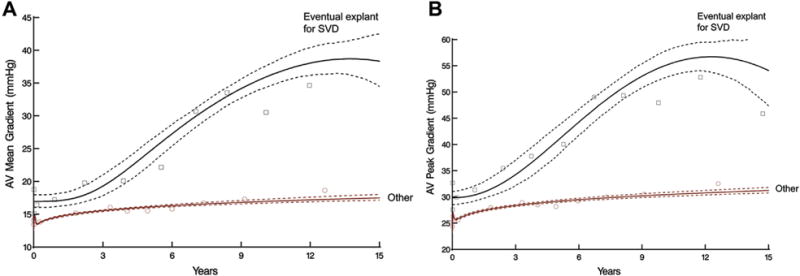
Fig 6.

Temporal trend of aortic valve (AV) gradients after AV replacement stratified by patients with eventual explant for structural valve deterioration (SVD) versus other patients. Solid lines represent parametric estimates enclosed within 68% bootstrap percentile confidence intervals. Symbols represent data grouped without regard to repeated measurements within time frame to provide crude verification of model fit. (A) AV mean gradient after AV replacement. (B) AV peak gradient after AV replacement.
