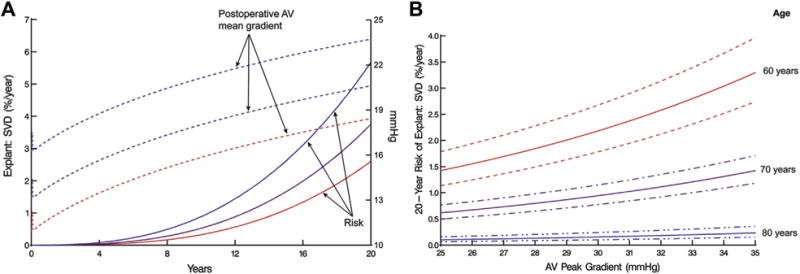
Fig 7.

Explantation for structural valve deterioration (SVD) and postoperative mean transvalvular pressure gradient. (A) Unadjusted relationship between instantaneous risk of explant owing to SVD (left vertical axis) and temporal trend of mean postoperative aortic valve (AV) mean gradient (right vertical axis). Solid lines represent risk of explant for SVD; dashed lines represent 3 patient-specific profiles of postoperative AV mean gradient. Blue lines (top) represent the trend for a patient whose profile is at the 85th percentile. Purple lines (middle) represent the trend for a patient whose profile is at the 50th percentile. Red lines (bottom) represent the trend for a patient whose profile is at the 15th percentile. (B) Explant owing to SVD by 20 years (left vertical axis) according to postoperative AV peak gradient and age at implantation, with dashed lines representing 68% confidence bands. This is a nomogram of the multivariable equation in Table 2.
