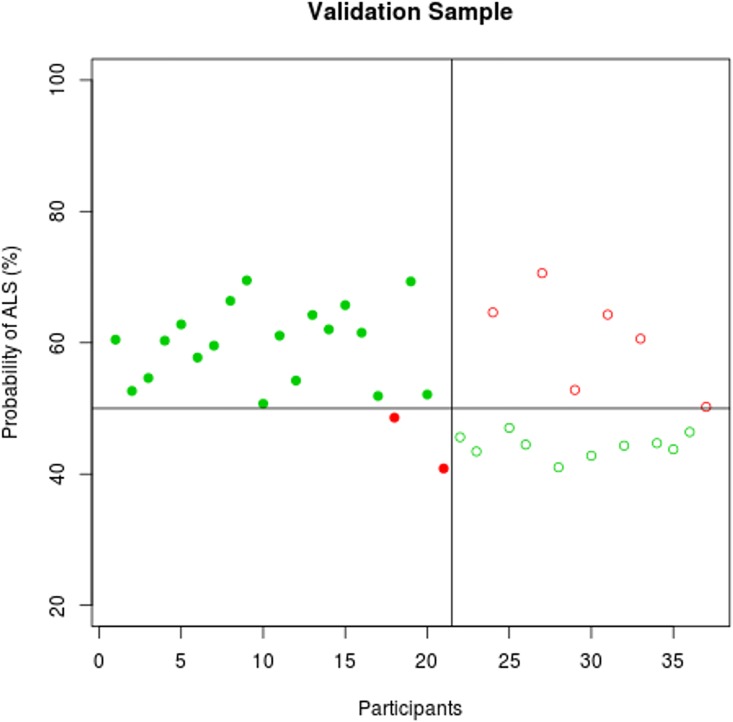
Fig 4. Classification accuracy in the validation sample.
The probability of individual participant’s MRI data demonstrating ALS-specific change based on the classification algorithm. Patients with ALS are represented by filled circles, healthy controls by empty circles. Misclassified participants are displayed in red; correctly classified participants in green.

