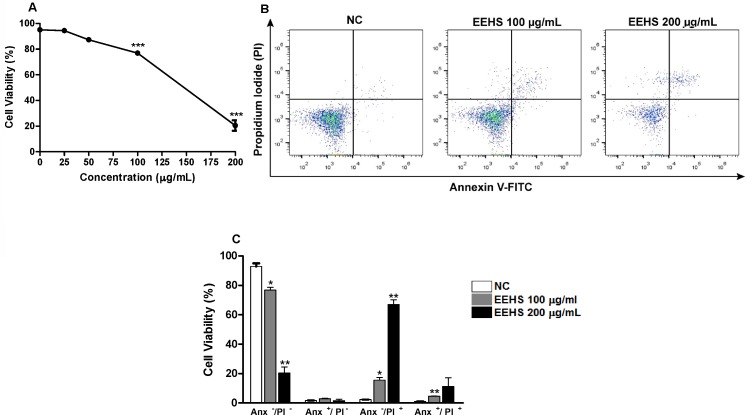
Fig 5. Cytotoxic activity of the EEHS in the acute myeloid leukemia cell line Kasumi-1.
(A) Concentration-response curve (25–200 μg/mL). (B) Dot plots indicating the flow cytometry data of cells stained with propidium iodide (PI) and annexin-V-FITC (An) treated with a negative control (NC), 100 μg/mL of the EEHS or 200 μg/mL of the EEHS. The lower left quadrant shows viable cells (An–/PI–); the lower right quadrant shows apoptotic cells (An+/PI–); the upper left quadrant shows cells undergoing necrosis (An–/PI+); and the upper right quadrant shows cells in late apoptosis (An+/PI+). (C) Percentage of cell death obtained from dot plots of cells treated with NC, 100 μg/mL of the EEHS, or 200 μg/mL of the EEHS. * P < 0.05, ** P < 0.01 and *** P < 0.001 when the treated groups were compared with the control group.

