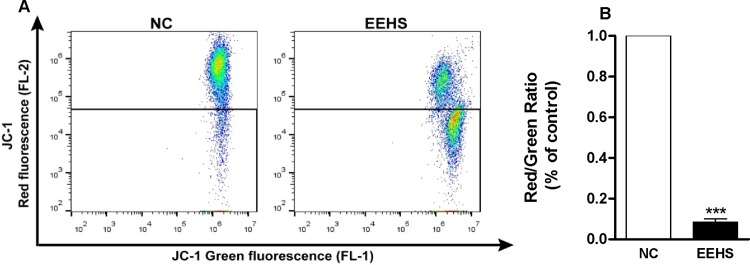
Fig 6. Estimation of the effect of the EEHS (160 μg/mL) on the mitochondrial membrane potential of the acute myeloid leukemia cell line Kasumi-1 by flow cytometry.
(A) Dot plots of flow cytometric data indicating the pattern of cell staining using JC-1 in green (FL-1) and red (FL-2). (B) Percentage of change of the mitochondrial membrane potential obtained from dot plots. *** P < 0.001 when the treated groups were compared with the control group.

