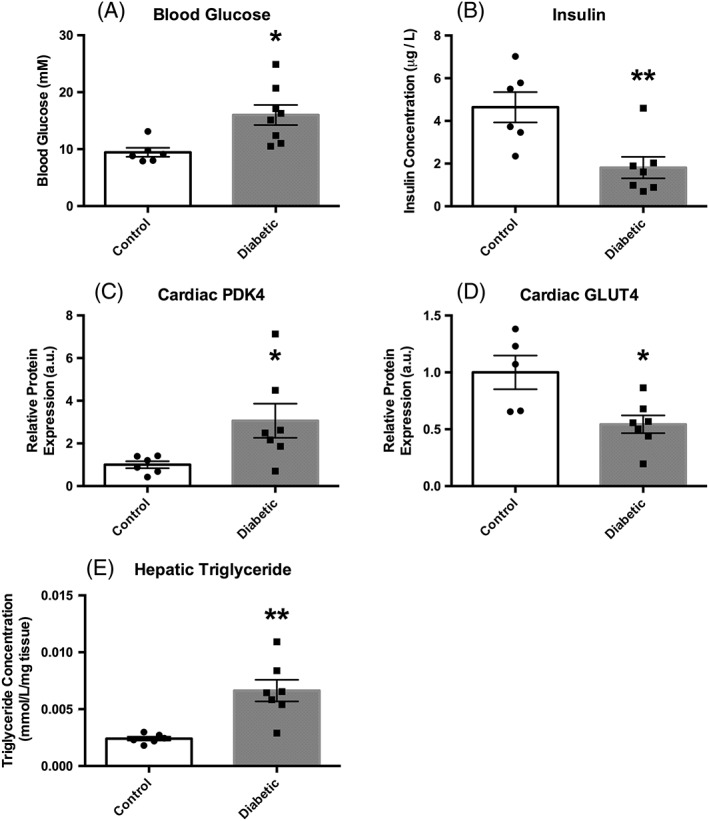
Figure 4.

Biochemical data acquired from control (n = 6) and diabetic (n = 7) animals. (A), Blood glucose levels. (B), Plasma insulin concentrations. (C), Cardiac PDK4 protein expression. (D), Cardiac GLUT4 protein expression. (E), Hepatic triglyceride concentrations. All data are presented as the mean ± SEM along with the individual data points for clarity. *p ≤ 0.05; **p ≤ 0.01
