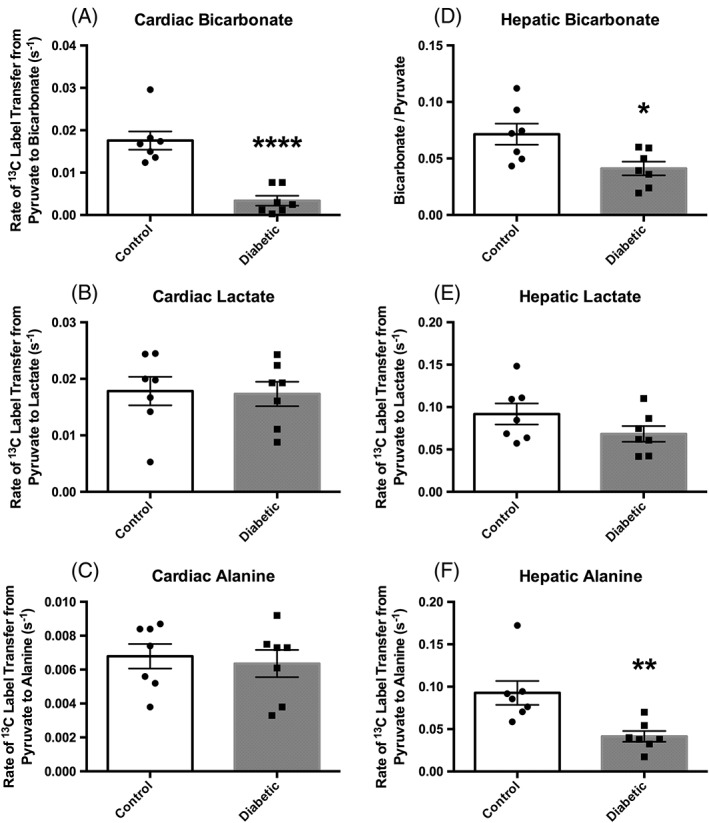
Figure 5.

Metabolic data acquired using the two‐slice acquisition in control (n = 7) and diabetic (n = 7) animals. (A), Cardiac PDH flux. (B), Cardiac 13C label transfer to lactate. (C), Cardiac 13C label transfer to alanine. (D), Hepatic bicarbonate–pyruvate ratio. (E), Hepatic 13C label transfer to lactate. (F), Hepatic 13C label transfer to alanine. All data are presented as the mean ± SEM along with the individual data points for clarity. *p ≤ 0.05; **p ≤ 0.01; ****p ≤ 0.0001
