
Figure 3.
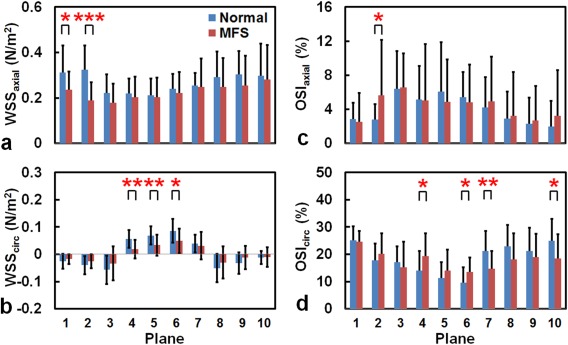
The WSS (a,b) and OSI (c,d) in 10 planes along the aorta of normal subjects (blue) and MFS patients (red). *P < 0.05, **P < 0.01, ***P < 0.001.
Official websites use .gov
A
.gov website belongs to an official
government organization in the United States.
Secure .gov websites use HTTPS
A lock (
) or https:// means you've safely
connected to the .gov website. Share sensitive
information only on official, secure websites.
The WSS (a,b) and OSI (c,d) in 10 planes along the aorta of normal subjects (blue) and MFS patients (red). *P < 0.05, **P < 0.01, ***P < 0.001.