
Figure 5.
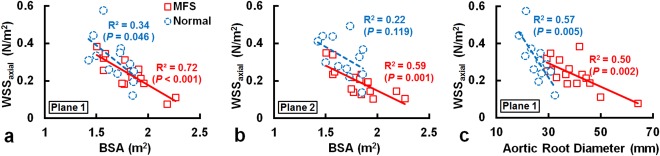
The WSSaxial and BSA exhibited strong correlations in Planes 1 (a) and 2 (b) in MFS group. The WSSaxial also displayed moderate correlation with ARD in Plane 1 in the MFS and normal groups (c).
Official websites use .gov
A
.gov website belongs to an official
government organization in the United States.
Secure .gov websites use HTTPS
A lock (
) or https:// means you've safely
connected to the .gov website. Share sensitive
information only on official, secure websites.
The WSSaxial and BSA exhibited strong correlations in Planes 1 (a) and 2 (b) in MFS group. The WSSaxial also displayed moderate correlation with ARD in Plane 1 in the MFS and normal groups (c).