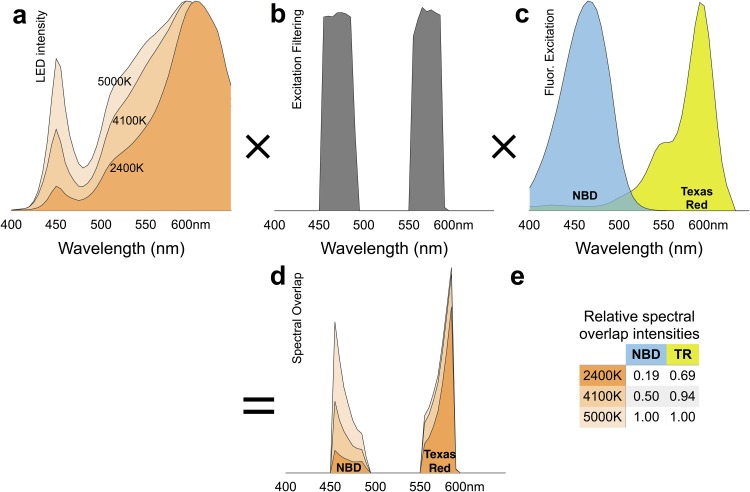
Fig 2. Calculating light-source, filter and fluorphore spectral overlap.
a: Emission of three consumer LED bulbs (TCP LED10P20D24/ 41/ 50KNFL) of labelled color temperatures. b: Transmission spectrum of fluorescence excitation filterset (Chroma 59022). c: Excitation spectra of NBD and Texas-Red dyes commonly used in our laboratory. d: The product of multiplying the spectra in a/b/c together. e: Relative efficiency of the different light sources for the two probes, determined by integrating the area under the curves of the spectra in d. Here the 5000K bulb is best suited for our fluorophores.

