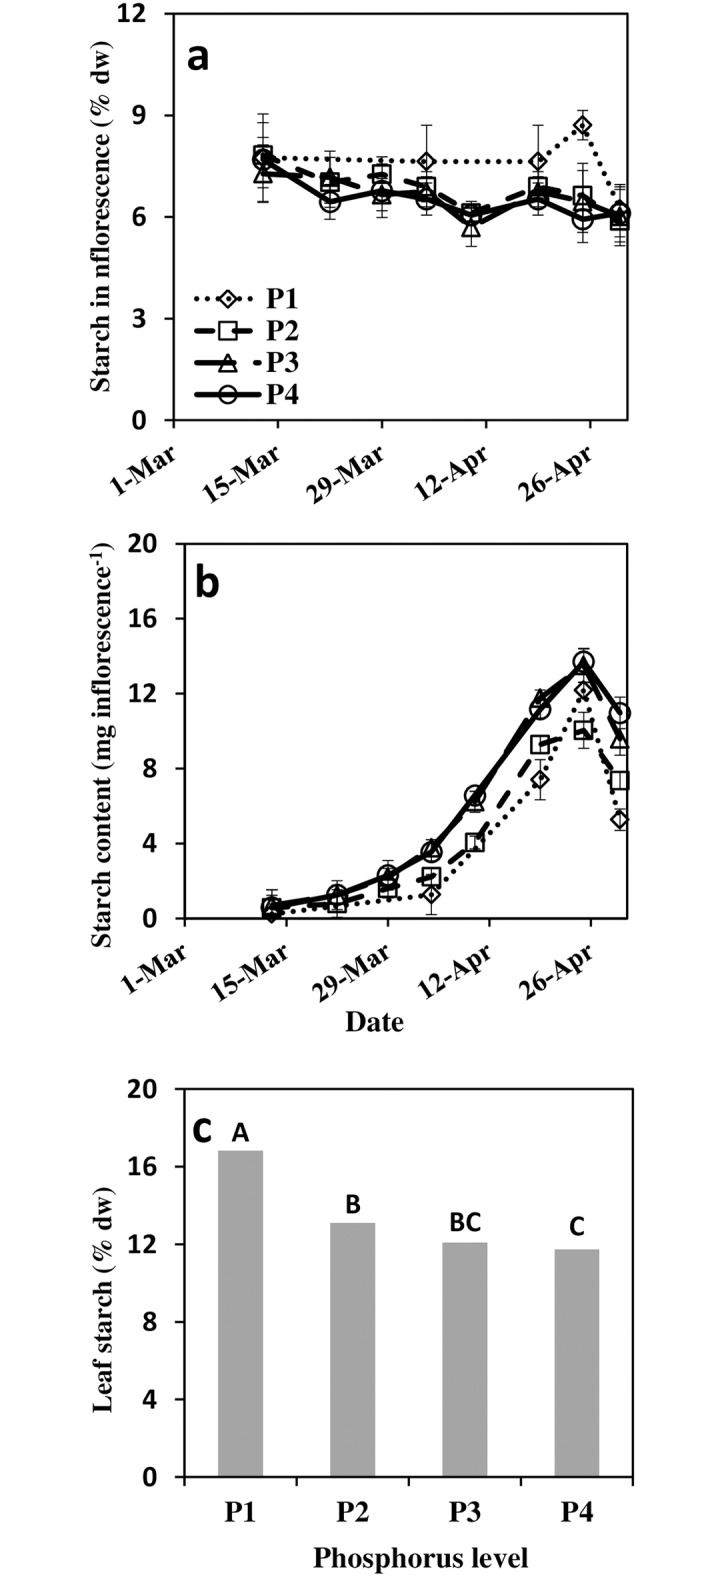
Fig 3. Starch concentration (a) and starch content (b) in developing inflorescences and starch concentration in leaves (c) as a function of four phosphorus levels (0.1, 1, 10 and 26 mg l-1 P in irrigation for P1–P4 respectively).

For the inflorescences, each point represents average of four trees per treatment and two repetitions per tree (n = 8). Error bars indicate standard deviation. Leaves were sampled on May 18th 2012. Each point represents the average of three trees per treatment and eight repetitions per tree (n = 24), different letters indicate significant differences at p<0.05.
