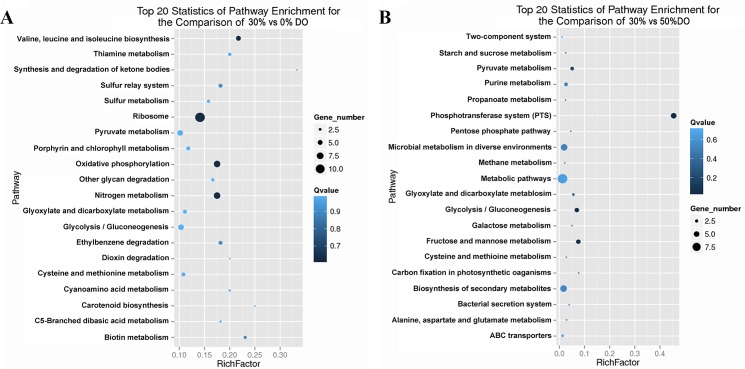
Fig 2. Scatter plot of the KEGG pathway enrichment statistics under different DO conditions.
(A) The top 20 enrichment pathways under the low DO level (30% vs 0%). (B) The top 20 enrichment pathways under high DO conditions (50% vs 30%). A larger RichFactor indicates greater intensiveness. The Qvalue is the corrected p-value ranging from 0 to 1, and a lower value indicates greater intensiveness.

