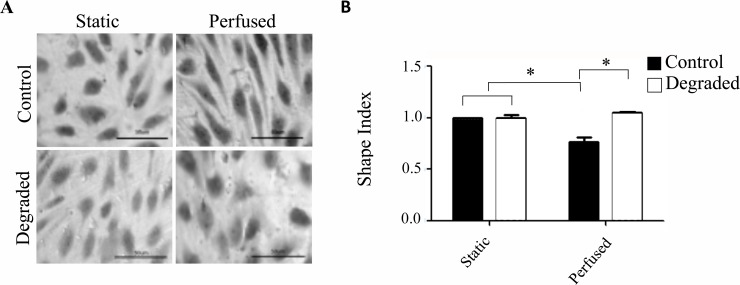
Fig 3. Morphological response of HAAECs with degradation and 24 hours of LSS in 3D cell culture models.
(A) Representative light microscope images of HAAECs stained with crystal violet. Images were acquired at 40x magnification (scale bars = 50μm). (B) Quantification of cell morphology based on the shape index and normalized to static control (n = 3, *p<0.05, error bars represent SEM).

