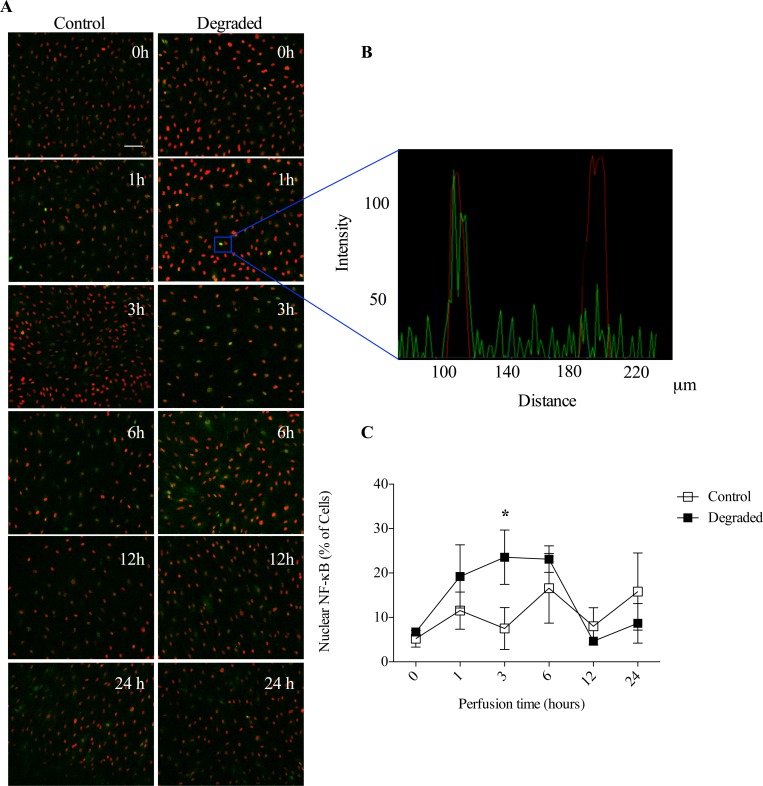
Fig 7. NF-κB response with flow and degradation.
(A) Representative images from confocal microscopy of NF-κB (green) and nuclear counterstain (red) following exposure to different flow times. Images were acquired at 10x magnification (scale bar = 50μm). (B) Representative histogram showing a cell with nuclear NF-κB localization (overlap of green and red signals) versus a cell without NF-κB in the nucleus (no green overlap). These graphs were used to quantify the number of cells with NF-κB in the nucleus. (C) Quantification of the number of cells with nuclear NF-κB over time in either control or degraded conditions (n = 3, *p<0.05, error bars represent SEM).

