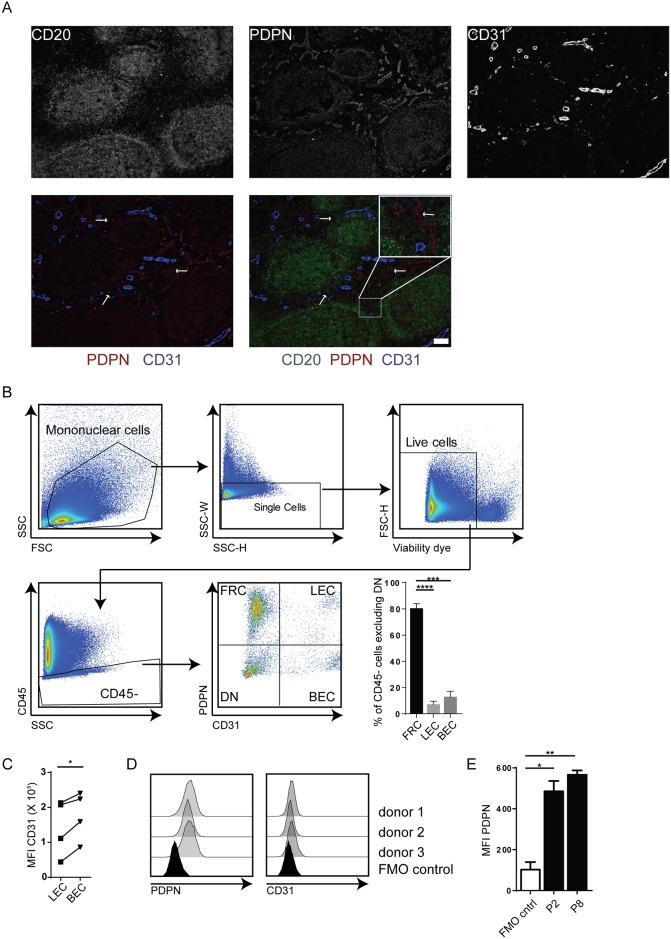
Fig 1. Isolated stromal cells show phenotypic characteristics of FRCs, LECs and BECs.
(A) Representative immune fluorescence staining of tonsil tissue stained for CD20 (green), PDPN (red) and CD31 (blue). Bars represents 50μm for all images. (B) Gating strategy and ex vivo phenotype of isolated stomal cells. Mononuclear cells were gated based on FSC vs SSC profile, after which a gate was set on single cells. Dead cells were subsequently excluded using a viability dye staining and a gate was set for CD45- cells. Finally, FRCs, LECs and BECs were defined by staining for PDPN and CD31. Plot shows percentages of FRCs (PDPN+CD31-), LECs (PDPN+CD31+) and BECs (PDPN-CD31+) within the CD45- cells upon exclusion of DN stromal cells. Staining shown is representative for stainings of 5 different donors. ***: p < 0.001, ****: p < 0.0001, Two Way ANOVA with Turkey’s multiple comparison test. (C) Expression levels of CD31 on LECs in comparison to BECs. *: p<0.05, Wilcoxon matched-pairs signed rank test. (D) Phenotype of cultured cell lines. PDPN and CD31 staining of cells cultured for 2 passages of 3 independent donors. (E) PDPN expression through culturing. Shown are the MFI values of PDPN staining upon culture for 2 (P2) or 8 (P8) passages of 3 independent donors. *: p < 0.05, **: p < 0.001, Two Way ANOVA with Turkey’s multiple comparison test. For all plots: error bars represent mean ±SD.

