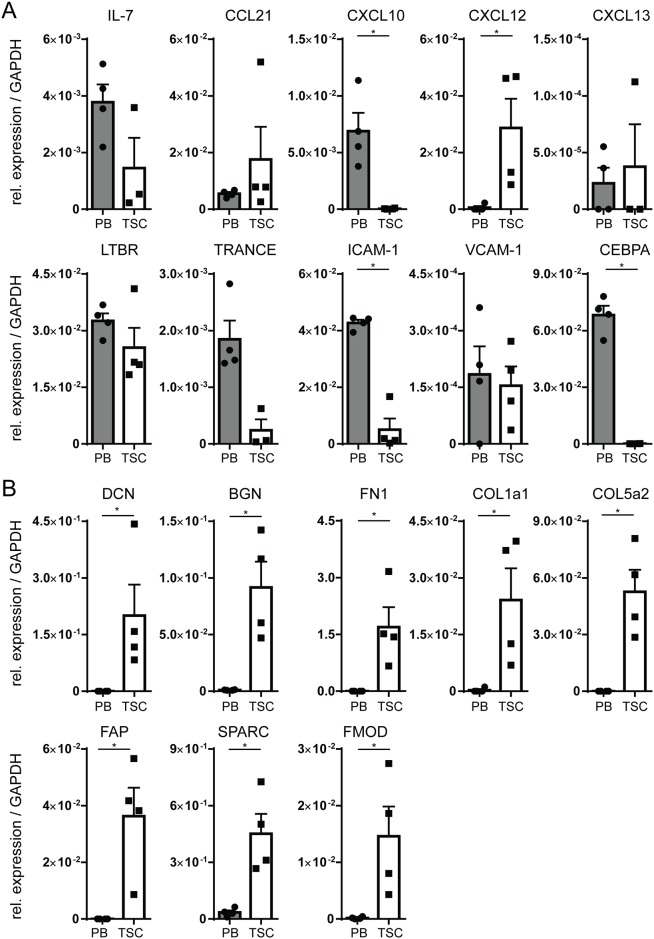
Fig 2. Transcript expression of stromal-associated genes by cultured TSC.
(A) PCR analysis of cultured TSC (harvested at passage 2 or 3, n = 4 individual donors) as compared to PBMCs (n = 4 individual donors) for cytokines/ chemokines and their receptor, associated with lymphoid stromal cells. Shown is expression relative to GAPDH. (B) PCR analysis of cultured TSC (harvested at passage 2 or 3, n = 4 individual donors) as compared to PBMCs (n = 4 individual donors) for genes associated with extracellular matrix. Shown is expression relative to GAPDH. For all plots: *: p < 0.05, Two Tailed Mann-Whitney Test, error plots represent mean ± SEM.

