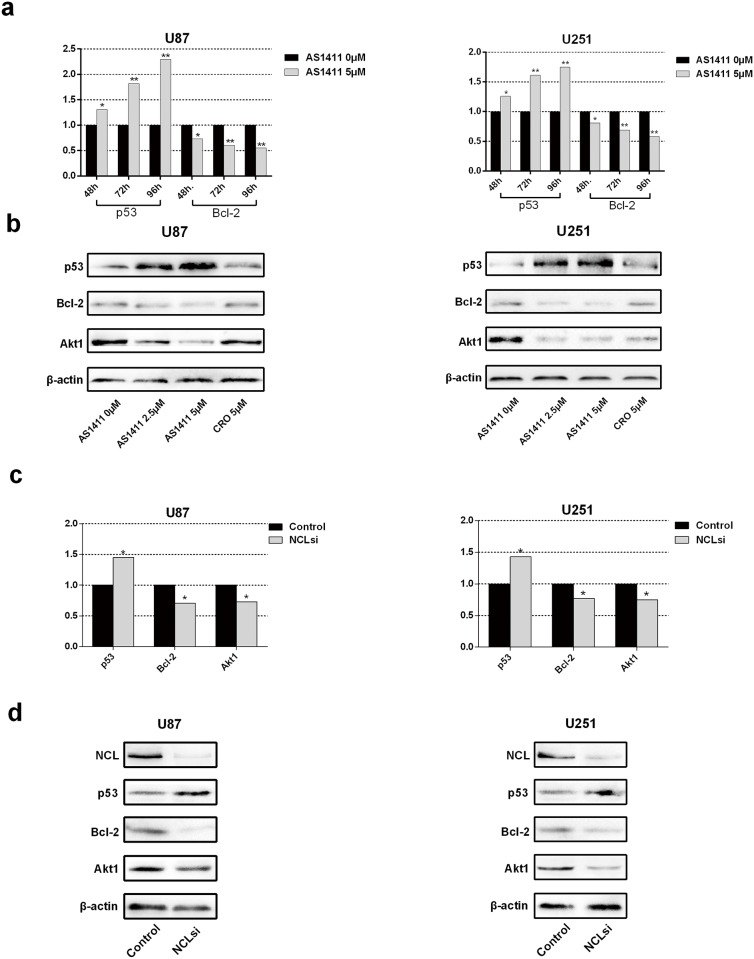
Fig 3. Expression of Bcl-2, p53, Akt1 after AS1411 treatment and NCL silencing in U87 and U251 cells.
(a) Real-time qPCR detection of Bcl-2, p53 and Akt1 mRNA in U251 and U87 cells after treatment with AS1411 (5 μM) for 48 h, 72 h and 96 h. (b) Immunoblotting analysis of Bcl-2, p53 and Akt1 in U251 and U87 cells treated with AS1411 (5 μM) for 48 h, β-actin used as loading control. (c) Real-time qPCR detection of Bcl-2, p53 and Akt1 mRNA after siRNA NCL silencing in U87 cells and U251 cells for 48 h. Immunoblotting detection of p53, Bcl-2 and Akt1 after siRNA NCL silencing in U87 and U251 cells for 48 h. (d) Error bars indicate ± s.d. *P<0.05, **P< 0.01, two-tailed student’s t-test.

