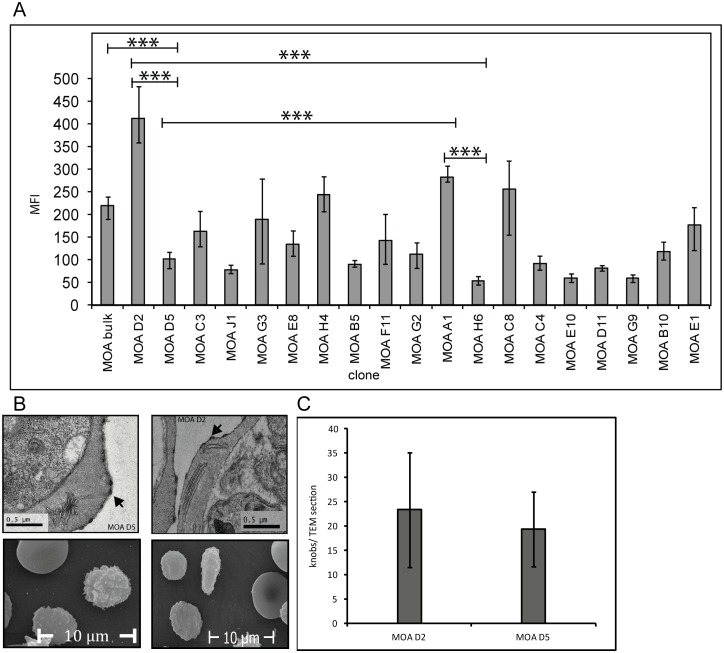
Fig 2. Flow cytometry signals with day 70 serum on MOA bulk and MOA clones are variable.
(A) Mean fluorescence intensities (MFI) obtained with MOA serum of day 70 followed by staining with a secondary antibody attached to FITC shows variable surface recognition signals ranging from low (< 80 MFI) to medium (81–160 MFI) and high (> 160 MFI) in MOA bulk and in the MOA clones. Error bars reflect the mean error of at least three independent experiments (Student´s t-test: MOA bulk vs. D5: p = 0.008, A1 vs. H6: p = 0.0003, D2 vs. D5: p = 0.0001, D2 vs. H6: p = 0.008, D5 vs. A1: p = 0.0002). (B) and (C) show transmission and scanning electron microscopy graphs of two representative clones with a highly significant difference in surface recognition signal (MOA D2 and MOA D5) and the presence of knobs (arrows) in equal numbers. Knobs were quantified per TEM cut of each clone.

