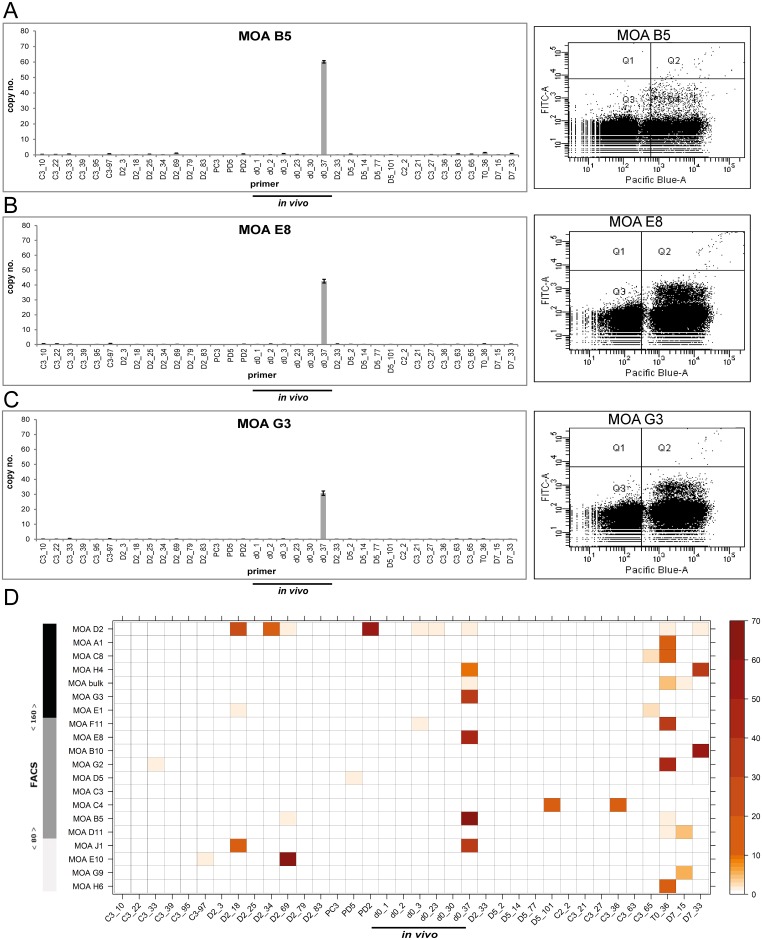
Fig 3. No correlation of var gene transcription and flow cytometry signals in clonal parasite populations.
(A) Left panel: var gene transcription profile of the clone B5 transcribing the MOA in vivo transcript d0_37 with the highest transcription signal. The transcription signal is quantified as relative copy number (RCN) of the housekeeping gene arginyl-tRNA synthetase (PFL0900 c) (n = 3, standard errors are given) on the y-axis. The 36 primer pairs are depicted on the x-axis. The 6 primer pairs quantifying in vivo transcripts are underlined. Right panel: The corresponding dot plot after incubation with MOA serum of day 70. DNA signals by staining with Hoechst-33342 are depicted on the x-axis ("Pacific Blue-A"), the antibody recognition signal is depicted at the y-axis ("FITC-A"). Uninfected red blood cells are shown in area Q3, infected erythrocytes with both strong (upper cloud) and weak (lower cloud) signals accumulate in Q4. (B) and (C) var gene transcription profiles of clones MOA E8 and MOA G3 transcribing d0_37 at lower transcription signals but exhibiting higher surface signals than clone B5. (D) Heat map correlating var gene transcription and flow cytometry signal in 19 MOA clones and the MOA bulk culture. The FACS signal is quantified by the left bar with a colour code ranging from black (high: MFI > 160) to dark grey (medium: MFI 81–159) to light grey (weak: MFI < 80). All MOA clones and MOA bulk are sorted according to their corresponding flow cytometry signal and depicted on the y-axis. The MOA specific primer set for 36 var loci is listed on the x-axis. var gene transcription is colour coded as indicated by the bar on the right. var genes marked in red are those with the highest transcription signal and var genes in white are those with very low (<3%) or no transcription. Note that clones transcribing d0_37 and T0_36 are evenly distributed from high to low flow cytometry signals.

