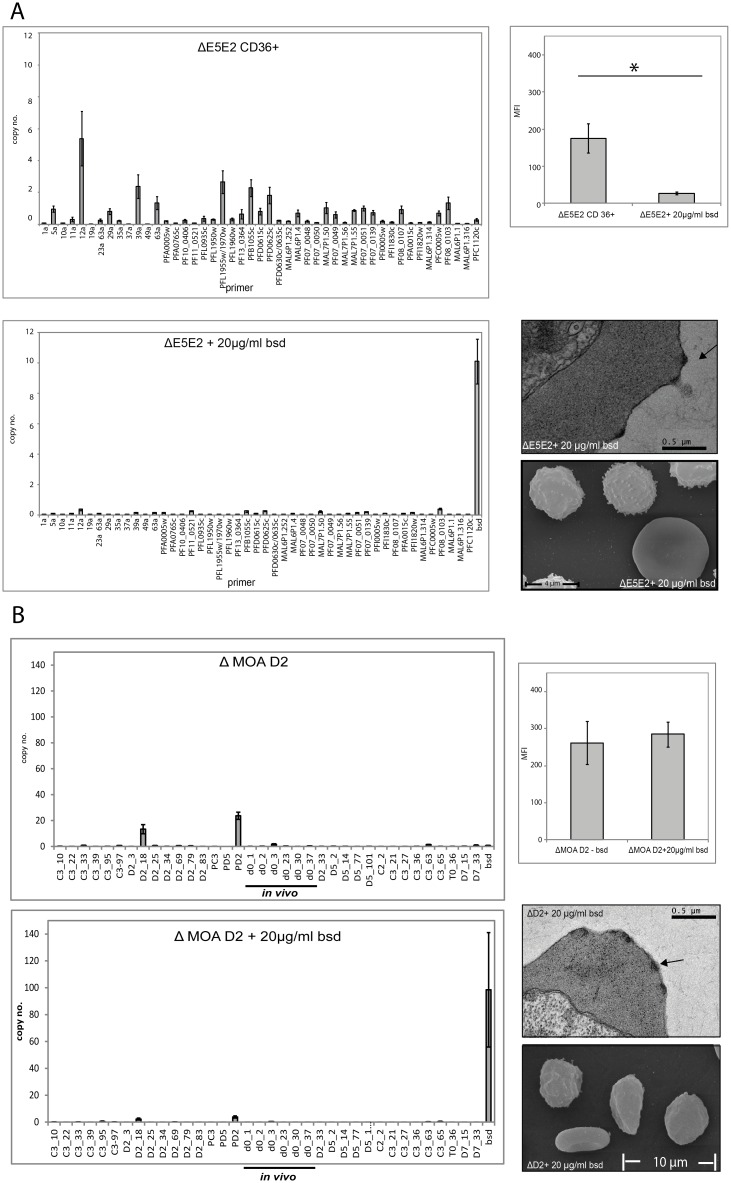
Fig 7. var knock-down removes the FACS signal in NF 54 E5 but not in MOA D2.
(A) var gene transcription profiles of the transgenic ΔE5E2 strain. The upper panel shows the var gene transcription profile of the ΔE5E2 cell line after CD36 receptor binding selection without blasticidin pressure. The lower panel depicts the same cell line after var gene knock-down. The corresponding flow cytometry signals (serum of day 70) are shown in the upper bar graph on the right. The mean fluorescence (MFI) is significantly reduced in the knock-down cell line (standard errors are given, p = 0.02, n = 4). The transmission electron microscopy (TEM) picture and the scanning electron microscopy picture (SEM) show that the E5 var knock-down cell line has intact knobs. (B) var gene transcription profile of transgenic MOA ΔD2 cell line without (upper graph) and with (lower graph) blasticidin pressure. Flow cytometry with serum of day 70 does not reveal any difference in their surface recognition signals of the two cell lines (standard errors are given, n = 3). The TEM and SEM pictures of MOA ΔD2 also clearly identify knobs in the erythrocyte surface membrane.

