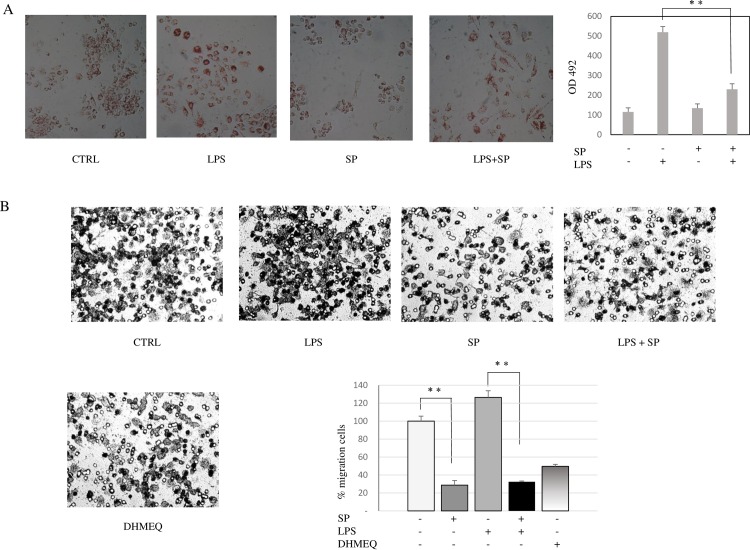
Fig 4. Effects of SP on LPS-mediated macrophages phagocytosis and migration.
(A) RAW 264.7 cells were incubated with SP (10 μM) and/or LPS (100 ng/ml) for 24 hours and neutral red phagocytosis was evaluated by adding dye for 1 hour at 492 nm. Data are means ± SD. ** p<0.01 versus untreated. The morphology of the treated cells were visualised by Zeiss microscopy at a 20 x magnification. (B) RAW 264.7 cells were plated on the upper chamber; SP (10 μM) and LPS (100 ng/ml) were used as a chemoattractant in the lower chamber. DHMEQ (2.5 μg/ml) was used as p65 nuclear translocation inhibitor. After 24 hours, quantification of transwells migration was evaluated by counting five random fields per treatment well and averaged across two independent experiments by light microscopy (20 X). The results are presented as migration percent in relation to the total number of untreated cells. Values are means ± SD. ** p<0.01 versus untreated or versus each drugs alone.

