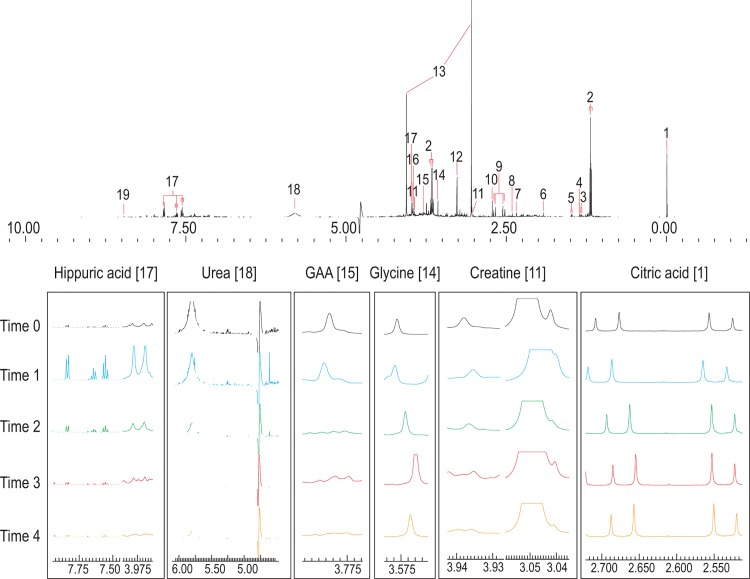
Fig 3. 500 MHz 1H-NMR spectra of urine.
Top spectrum taken from QC sample; numbers indicate the following metabolites: 1: TSP; 2: ethanol; 3: lactic acid; 4: 2-hydroxyisobutyric acid; 5: alanine; 6: acetic acid; 7: pyruvic acid; 8: succinic acid; 9: citric acid; 10: dimethylamine; 11: creatine; 12: trimethylamine-N-oxide (TMAO); 13: creatinine; 14: glycine; 15: guanidinoacetic acid (GAA); 16: glycolic acid; 17: hippuric acid; 18: urea; 19: formic acid. The six important metabolites (high VIP values) are highlighted below to qualitatively show differences over time 0 (black), 1 (blue), 2 (green), 3 (red) and 4 (orange)–scaled according to creatinine. Apart from citric acid and hippuric acid, the detoxification product of benzoic acid, no other constituents from the vehicle appeared to be detectable in the NMR analysis.

