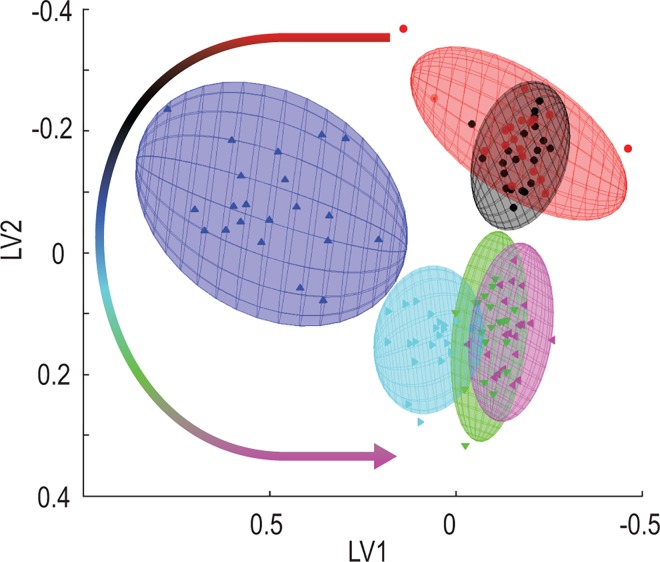
Fig 6. Application of ASCA to the 344 NMR spectral bins for 21 individuals over the period of the intervention.
Plots of the sum of the ASCA effects and projected residuals are color coded according to time following the intervention (–1, 0, 1, 2, 3 and 4 hours shown in red, black, blue, light blue, green and pink, respectively), with the arrow showing the time-dependent trend, using the same discriminating color sequence.

