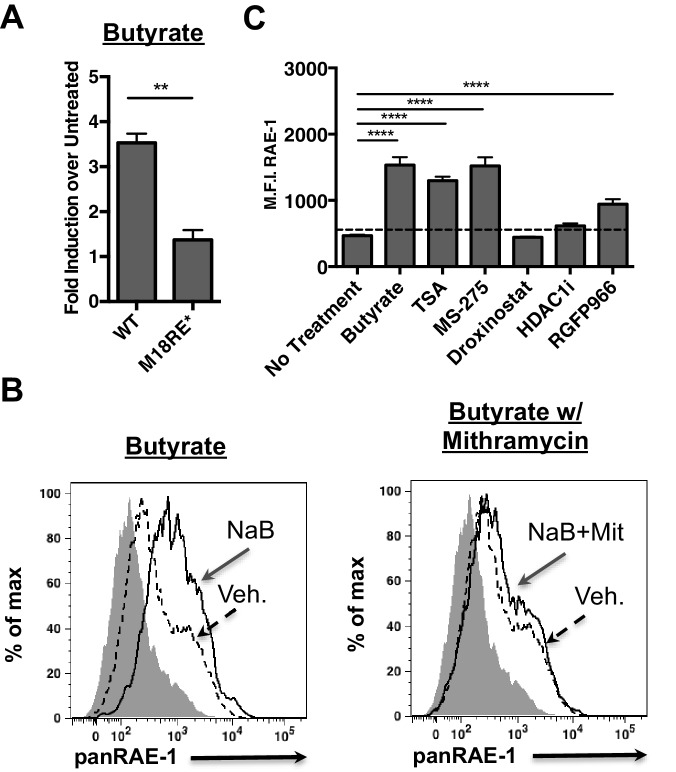
Figure 4. HDAC inhibition drives RAE-1 expression in an Sp factor dependent manner.
(A) Raet1e promoter activity was measured in lysates from mouse fibroblasts transfected with either WT Raet1e promoter or the m18RE* promoter treated with sodium butyrate (NaB) (1 mM). Data are expressed as fold change between butyrate treated and untreated promoter. Data are represented as mean±SEM. Data are representative of three independent experiments. **p<0.005 (Student’s T-test). (B) Cells treated with NaB (1 mM) with or without Mithramycin (1.5 μM) were analyzed for RAE-1 expression by flow cytometry. Data are representative of five independent experiments. (C) Cells were treated with HDAC inhibitors TSA (1 nM) (pan-HDACi), NaB (0.1 mM) (Class I and IIa), MS-275 (800 nM) (HDAC1,3), RGFP966 (640 nM) (HDAC3) 4-(dimethylamino)-N-[6-(hydroxyamino)−6-oxohexyl]-benzamide (HDAC1i) (1 μM) (HDAC1), or Droxinostat (3 μM) (HDAC6,8) and analyzed for RAE-1 expression by flow cytometry. Data are represented as mean fluorescent intensity±SEM. Data are representative of three independent experiments. ****p<0.00005 (1 way ANOVA with Bonferroni’s multiple comparison post-test).

