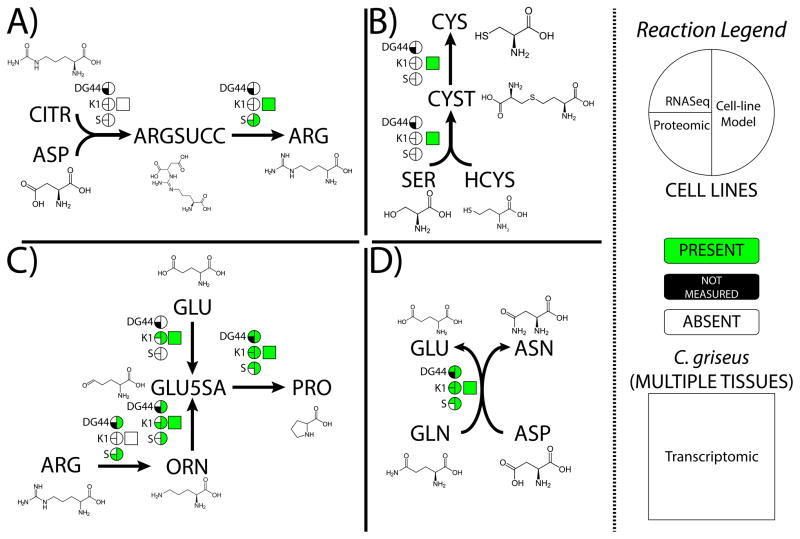
Figure 4. The models provide insights into the molecular basis of CHO-specific amino acid auxotrophies.
(A) Arginine, (B) Cysteine, (C) Proline, (D) Asparagine. For each reaction, information in the circles indicates whether the enzyme catalyzing the reaction is seen in transcriptomic (upper left quarter-circle) and/or proteomic (lower left quarter-circle) data, as well as its presence or absence in the cell line specific models generated by GIMME (right semi-circle). The square shows whether the enzyme catalyzing the reaction is seen in transcriptomic data from a mix of C. griseus tissues. Data used is available in Supplemental Data S4. Metabolite abbreviations are as follows: CITR-citrulline, ASP-aspartate, ARGSUCC-argininosuccinate, ARG-arginine, SER-serine, HCYS-homocysteine, CYST-cystathionine, ORN-ornithine, GLU-glutamate, GLU5SA-glutamate 5 semialdehyde, PRO-proline, GLN-glutamine, ASN-asparagine.

