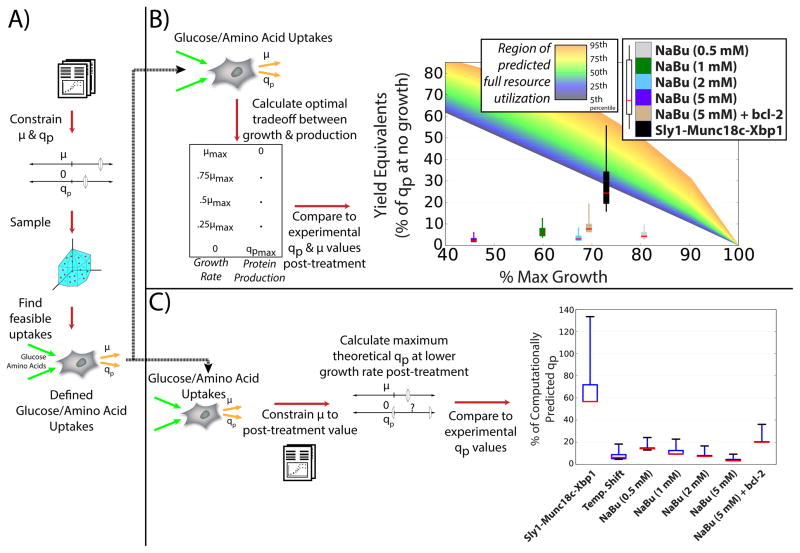
Figure 5. Resource utilization efficiency in CHO cell lines is greater after cell line engineering.
(A) Feasible uptake fluxes were generated for nutrient utilization efficiency analyses. Growth rates and specific productivities were obtained and used to constrain the model. By sampling the constrained model, a set of feasible metabolite uptake rates and secretion rates was calculated that support growth and production at the specified values. (B) The efficacy of resource utilization following common growth-inhibiting treatments in protein-producing CHO cell lines was quantified. Uptake and secretion rates from (A) were used to predict maximum growth (i.e., no protein production) and maximum protein yield (i.e., no growth), as well as yields at various fractions of maximum growth. These were used to predict a range of optimal protein production rates (i.e. making full use of resources) as growth rate decreases (indicated as a region of full resource utilization), thus showing the theoretical maximal protein secretion rates at decreased growth rates. The 5th, 25th, 50th, 75th, and 95th percentile of theoretical maximal protein production rates at each growth rate are indicated by the gradient in color from black to orange. After several cell treatments, the experimentally measured increased protein yield and decreased cell growth rate were compared to the predicted optimal protein secretion rates to assess how successfully each treatment utilized available resources (e.g., amino acids and sugars) for growth and protein production. Boxes span the 25th and 75th percentiles, whiskers represent the 5th and 95th percentiles, and a red line denotes the median value of overall resource utilization efficiency for each treatment, calculated as the ratio of experimentally measured protein production to the theoretical maximum protein yield (i.e., no growth). (C) The efficiency of diversion of resources toward protein production following common treatments was assessed. Uptake and secretion rates from (A) were used to compute the theoretical maximum specific productivity after cell line or process modifications yielding a range of theoretical optimal qp values were computed. Experimentally measured production rates were compared to the computational predictions to assess how effectively the cells are able to make use of resources gained from growing slower. Boxes span the 25th and 75th percentiles, whiskers represent the 5th and 95th percentiles, and a red line denoting the median value.

