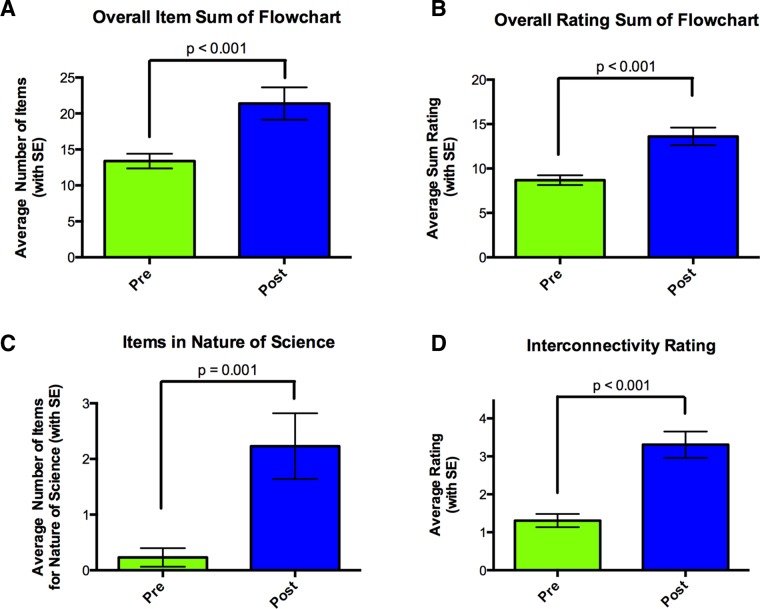
FIGURE 7.
Significant differences pre to post flowchart. p Value was calculated using a Wilcoxon matched-pairs signed-rank test. (A) Overall comparison of pre and post flowchart sum of items from rubric dimensions 2 through 4. (B) Overall comparison of pre and post flowchart sum of the ratings, where 1 = naïve; 2 = novice; 3 = intermediate; 4 = proficient; and 5 = expert. The total possible rating total is 25, and the lowest possible rating is 5. (C) Average number of items in the NOS, rubric item 4, in pre and post flowchart. (D) Average interconnectivity of pre and post flowchart.

