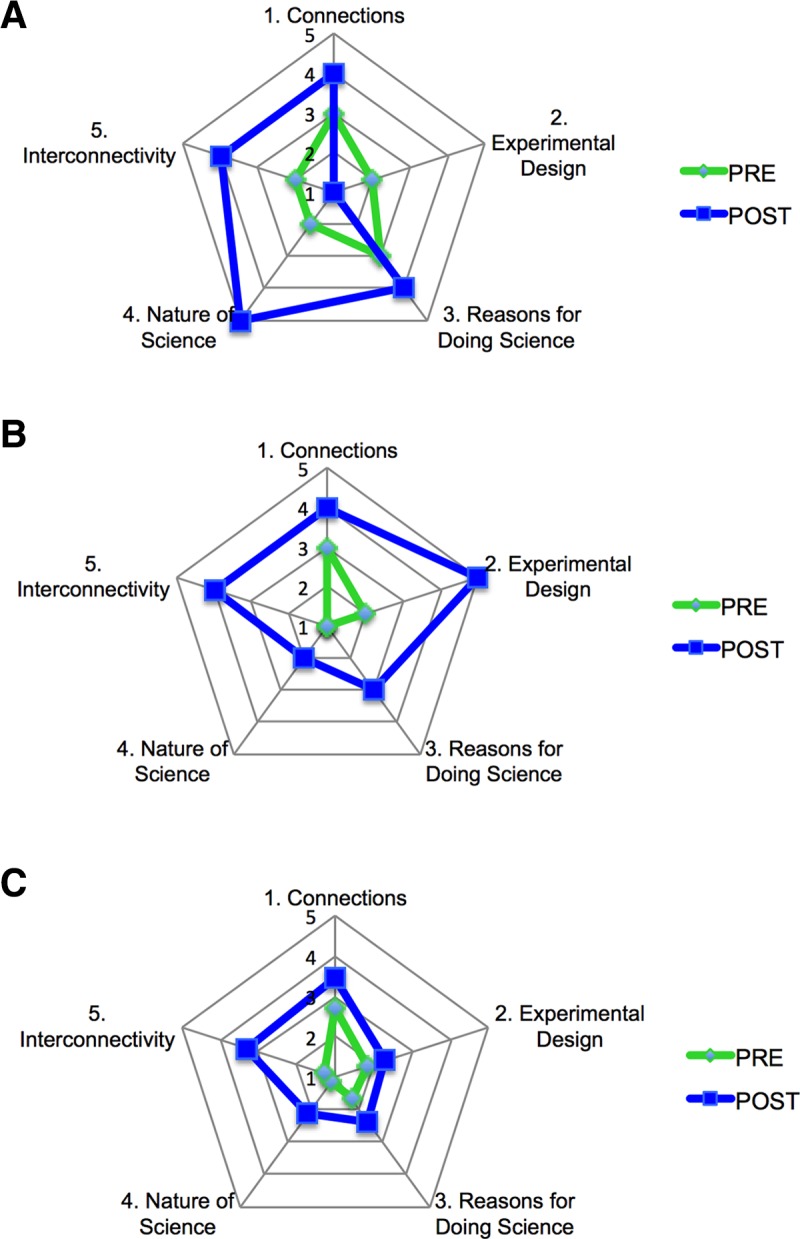
FIGURE 8.

Web representation of change in ratings from pre to post flowchart. A green line represents the pre flowchart and a blue line represents the post flowchart. (A) Web of individual ratings from example flowchart in Figure 3, A and B, showing both pre and post flowchart data. (B) Web of individual ratings from example flowchart in Figure 3, C and D, showing both pre and post flowchart data. (C) Web of average ratings for both pre and post flowchart.
